Understanding the US Dollar Impact on the Coffee Market – Part 2 – Predicting the USD
- Ryan Delany

- Apr 21, 2022
- 5 min read
The #USD directly impacts the price of #coffee (and all #commodities): Dollar strength lowers the prices of commodities and coffee, and dollar weakness increases prices. We looked at this in detail in our last Macro article. Therefor predicting the value of the dollar is an essential component of predicting coffee prices.
In this article, we will first outline our case that #monetarypolicy is the primary driver of USD prices, then we will go through how the Fed’s dual mandate drives monetary policy, and finally, we will outline how the US economy drives #FederealReserve policy. Putting this altogether amounts to a philosophy for anticipating macro-USD impact on #commodity prices like coffee.
Interest Rates and the USD
When predicting the US Dollar’s value, we can boil it down to one very broad rule:
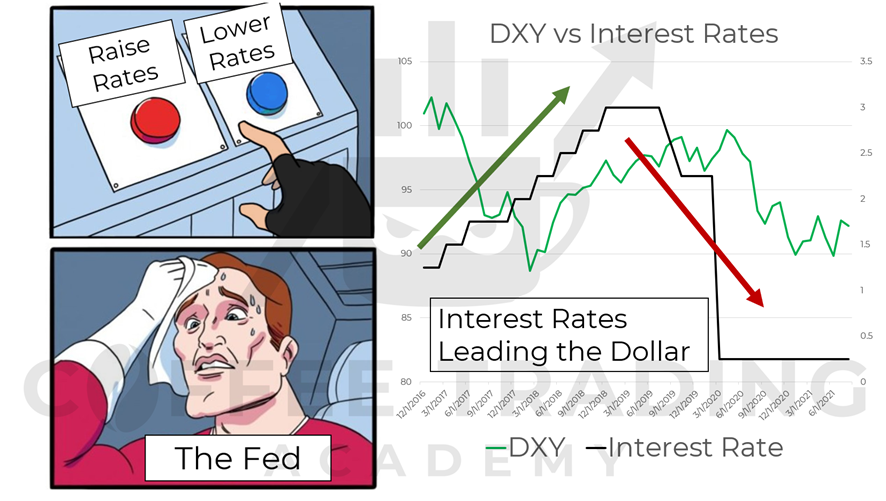
The USD is inversely correlated with interest rates.

High #interestrates (contractionary monetary policy) are bullish the USD, and low interest rates (expansionary monetary policy) are bearish the USD.
Therefore, when predicting the US dollar’s value, we are trying to predict how the Fed will affect interest rates.
When interest rates are high, dollars are valuable (because they gain more interest in the bank), and when rates are low, they are less valuable. The federal reserve doesn’t set these rates directly though, they change the supply of money and the interest rates reflect these changes.
Why the Fed Changes Interest Rates
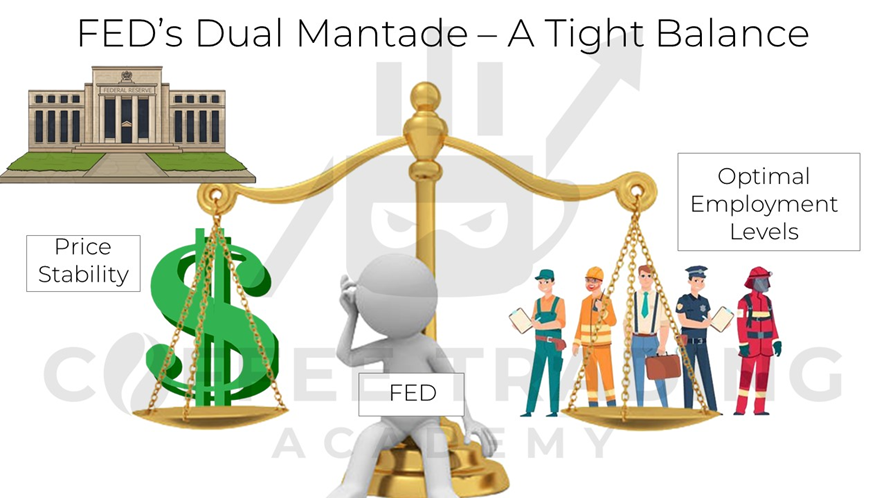
The Federal Reserve has a dual mandate to support the US economy and this support is defined through the dual mandate.
Fed’s Dual Mandate:
1) maintain 2% inflation
2) maintain 4-6% unemployment.
Interest rates are the primary tool to enact their dual mandate.
Since the Fed changes the #moneysupply (and therefore USD bullish/bearishness) according to their view on these two factors, we monitor both to anticipate how they will enact policy.
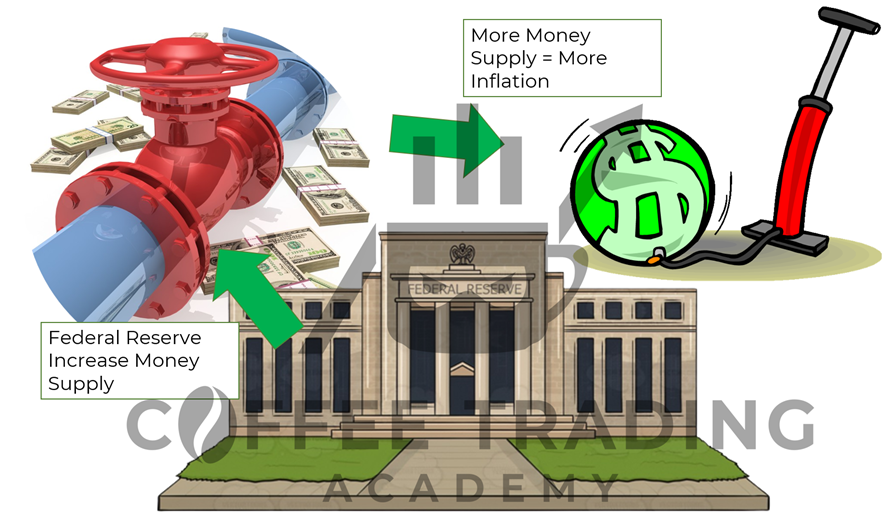
Before we look at the indicators themselves, let’s examine how the Fed views monetary policy. To put it very simply, the Fed has only one tool with 2 options. They can increase the supply of money or decrease the supply of money.
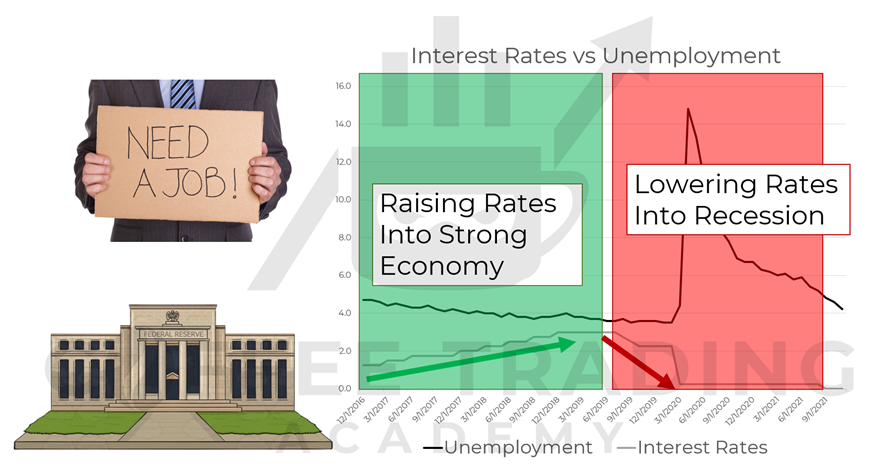
The Fed will increase the money supply (“expansionary monetary policy”) to stimulate the economy during a #recession (improve employment rates), or (in rare cases) to inflate an overly strong USD.
The Fed will decrease the supply of money (“contractionary monetary policy”) to control #inflation (make money worth more) or to keep an accelerating economy from forming an economic “bubble” (an unjustified inflation of prices).

This is the basic balancing act that the Fed will maintain to support the US economy, but in extreme cases, they may be forced to choose one priority over another.
Regardless of whether balancing or prioritizing one over the other, the Federal Reserve watches these economic indicators closely to determine which of there dual mandates are at risk, and they switch the lever accordingly.
The Other Policy Tool
Investors and traders will also monitor these indicators to anticipate how the Fed will act.
The Fed knows that investors will anticipate their moves, and in fact, they count on it. When I said the Fed only has one tool, that wasn’t entirely true. There is actually another tool as well: communication.
The Fed uses its press releases and minutes releases to intentionally telegraph how they will respond so that the market will move without them having to do anything.
By communicating well in advance to the market, this helps to ensure that public is not caught by surprise by Fed moves. A surprise in the market would create a chaotic repricing in the markets and that is not what the Fed wants. Instead, the idea is for stable and gradual repricing.
Economic Indicators
To understand how the Fed will react to the economy, we need to understand how they see the economy. They do this through "indicators." Indicators are key metrics that provide insight into the economy, and there are MANY of them.

With the vast array of economic data available, the first challenge is organizing them into a useful framework. In this paper we divide the indicators into 2 broad sections: Dual Mandate Indicators and Economic Indicators. We will look at the Dual Mandate Indicators in this article, and in the next article we will examine the Economic Indicators.
Dual Mandate Indicators:
These indicators are direct reports of whether the Fed is achieving its dual mandate. Of course, these indicators are important for determining the health of the US economy as a whole, we are focusing on them in this section as they can be used by the Fed to determine how to act.
It is also worth mentioning, that these indicators are primarily backward looking. In other words, they come out weeks and months after the fact. This means that the Fed will be less concerned with the actual monthly print, but rather the overall trend.
Inflation indicators:
Inflation in general refers to the price for a fixed basket of goods over time. As prices generally rise, inflation will increase, if prices generally fall, there will be deflation. We have multiple indices to represent inflation because there are different ways of creating the basket and weighing their importance.

Consumer Price Index (CPI) – The CPI is the granddaddy of inflation indicators as it was introduced in the 1980s but has been calculated going back to 1913. It is the most widely used measure of inflation and deflation. The CPI is a weighted average of prices of a basket of consumer goods and services, like food, transportation, medical care.
It’s calculated by the average of the price changes of the predetermined basket and is usually associated with the cost of living. Therefore, a positive and rising CPI means inflation, while a negative and lowering CPI means deflation.
Personal Consumption Index (PCE) – this index is the measure of inflation that is used primarily by the Fed and is considered (by them) to be the most reliable. It includes a broader basket of goods that also shows expenses by businesses and it is less volatile than the CPI.
Producer Price Index (PPI) – Is different from the CPI in that it measures the cost of goods as raw inputs to producers. Much of the PPI is commodity based, so commodity prices will be a more direct factor in this index.

Unemployment indicators:
Unemployment Rate – the Bureau of Labor Statistics (BLS) actually publishes 6 unemployment figures with U-3 being the most widely reported one and U-6 as the most comprehensive.
Labor Force Participation Rate – The Participation Rate reflects how much of the total available labor force is actually working. This is an important distinction from the Unemployment Rate, because changes can occur in the labor participation rate that may artificially inflate or deflate employment figures.
ADP National Employment Report – ADP handles about 20% of the nation’s total payroll services and as such is uniquely positioned to report on national employment figures. This report comes out once a month and is a good check preview of employment figures as it is much faster to calculate.
Nonfarm Payrolls (NFP) - The Nonfarm Payrolls, is also reported monthly by the Bureau of Labor Statistics (BLS) and indicates the actual number of new jobs added within the national economy, but excluding farm workers. Excluding farm workers makes the data better reflect overall economy as farm jobs are more seasonal and difficult to categorize.
Conclusion
In the coffee business, we care about dollar strength because it directly impacts the price of coffee, but its much bigger than coffee. Dollar strength impacts the price of commodities globally.
We can summarize USD analysis and forecasts by saying that the dollar is largely driven by interest rates and interest rates are controlled by the Federal Reserve.
The dollar market (like most markets) is forward looking, as participants are constantly trying to evaluate and anticipate how the Fed will act. The market does this by using the Fed’s dual mandate.
The market knows that the Federal Reserve is tasked with keeping inflation and unemployment rates at stable and optimal levels and will use interest rates to achieve those goals. We can look at these indicators directly to see how the Fed will determine their policy, however these indicators are somewhat backward looking.
In the next article, we will look at the other economic indicators to see how they can be used to anticipate changes in employment and inflation, and therefore anticipate changes in Fed policy.


Comments